
Disparate data sources, tight deadlines and demanding customers typify the environment faced by today’s supply chains. Supply chain leaders therefore need greater supply chain visibility for timely and effective decision-making. GEP’s supply chain dashboards provide decisive insights to help you monitor and manage your supply chain performance more effectively.
Featuring highly customizable and standardized key performance indicators (KPIs) and metrics, GEP’s supply chain dashboards allow efficient review of supply chain operations throughout the chain – across regions, business units, warehouses, manufacturing plants, and even brands and channels.
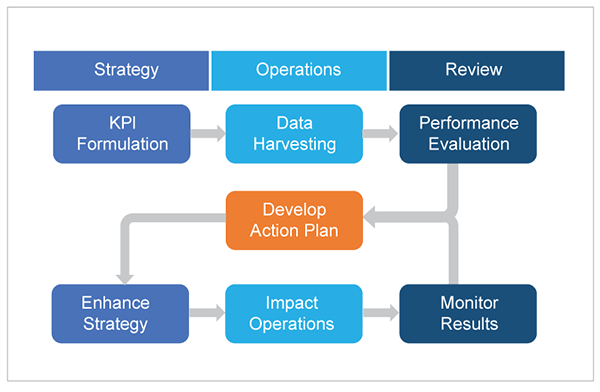
GEP's Supply Chain Dashboards - At a Glance
Identify Bottlenecks
With GEP’s supply chain dashboards, you get a better view of every aspect of your supply chain, uncover smoldering trouble spots and initiate action before they turn into bigger challenges. You can track the progress of various supply chain initiatives against identified metrics. You can deploy these dashboards rapidly and seamlessly into your supply chain network and with user-friendly interfaces, customize them to your organization’s needs.
Get End-to-End Visibility
GEP’s supply chain KPI dashboards enhance data visibility by delivering intuitive visuals that measure current performance against historical trends and targets, providing supply chain stakeholders with the insight needed to take targeted action.
With effective and responsive supply chain performance dashboards, enterprises can make better, timely decisions to drive value to customers, shareholders, and various stakeholders across the supply chain.
Why GEP’s Supply Chain Dashboards
With GEP’s powerful dashboards, you’ll have all the information you need, right at your fingertips – anytime, anywhere.
Standardized metrics
Commonly defined metrics across time, geographies and categories; benchmarks against industry standards
Data visibility
Meaningful data visualization and key trends through dashboard views with drill-down capability to a granular view of operations
Intuitive interface
Intelligent user-friendly functionality allows effortless viewing and analysis
Customized reports
Tailor data analysis to various business needs; schedule reports to run regularly in conjunction with internal progress meetings
Centralized repository
Secure access to an online platform for all consolidated supply chain management metric data for effective data storage and use
Performance evaluation
Executive summary dashboards and plant performance visualizers make it easy to track progress against targets, at all levels